| Top: John S. Allen's Home Page Up: Table of Contents Previous: Page separator Next: Chapter V separator |
| Top: John S. Allen's Home Page Up: Table of Contents Previous: Page separator Next: Chapter V separator |
CHAPTER IVBICYCLE ACCIDENT REPORTING AND MONITORINGThe study of reported bicycle accidents has been valuable for evaluating the bikeways. This chapter describes the nature and level of the bicycle accident reporting in Eugene, and presents a revised system for monitoring bicycle accidents. NATURE AND LEVEL OF BICYCLE ACCIDENT REPORTINGAn accident reporting survey was conducted to evaluate the extent of reporting injury accidents involving bicycles. The survey is summarized under the following sections:
A form, (Figure IV-1) was provided in local hospital emergency rooms and clinics. The form was voluntarily filled out by individuals who had sustained injuries while riding bicycles. The information obtained was used to determine what type of bicycle accidents are and are not reported to the Police. The voluntary reporting forms were made available by
(A special thanks belongs to each of these individuals, along with those who have helped them to conduct this survey.) |
FIGURE IV-1
VOLUNTARY ACCIDENT REPORTING FORM
________________________________________________________________________
HELLO!  SORRY ABOUT YOUR BICYCLE ACCIDENT. WE WOULD LIKE TO PLAN WAYS TO
MAKE BICYCLING SAFER IN EUGENE. WILL YOU HELP BY FILLING OUT THIS SHEET?
THE MAYOR'S BICYCLE COMMITTEE THANKS YOU.
1. DID YOUR ACCIDENT HAPPEN ON
_/ STREET INTERSECTION _/ STREET BETWEEN INTERSECTIONS
_/ DRIVEWAY _/ SIDEWALK
_/ BIKE PATH _/ PRIVATE PROPERTY
_/ OTHER
2. WHAT KIND OF ACCIDENT?
_/ BICYCLE HIT CAR _/ CAR HIT BICYCLE
_/ BICYCLE HIT BICYCLE _/ BICYCLE HIT FIXED OBJECT
_/ FALL _/ OTHER
3. WHAT WAS THE PURPOSE OF THE TRIP YOU WERE MAKING AT THE TIME OF YOUR
ACCIDENT?
_/ERRAND _/ SCHOOL _/ GOING TO FRIEND'S
_/ PLAYING A GAME _/ RECREATION _/ WORK
4. WHAT WERE THE LIGHTING CONDITIONS
_/ LIGHT _/ DARK
5. WHAT WAS THE WEATHER?
_/ CLEAR, DRY _/ OVERCAST _/ RAINING
6. WHEN DID THE ACCIDENT HAPPEN?
______________MONTH ______________DAY ______________YEAR
7. WHERE DID THE ACCIDENT HAPPEN?
___________________________________________________________________
8. HOW OLD ARE YOU?
9. SEX: MALE FEMALE
10. HOW MANY YEARS HAVE YOU BEEN RIDING A BICYCLE?
11. PLEASE DESCRIBE WHAT HAPPENED:
_______________________________________________________________________ _______________________________________________________________________ _______________________________________________________________________
12. DO YOU PLAN TO FILE A REPORT OF YOUR ACCIDENT WITH THE POLICE?
_/ YES _/ NO
|
| SAMPLE PERIOD
A three-month sample period (September 1 to November 30, 1978) was used for this survey, with the forms available in each of the locations shown on Page IV-1. A summary of the results is presented in Table IV-1 on the following page. The accidents have been divided into two groups: accidents involving motor vehicles, and accidents not involving motor vehicles. The numbers of the Voluntary Reports, Police Reports, and accidents for which both reports were completed, are shown in the table. TABLE IV-1
During the three-month sample period (September 1 to November 30, 1979), the Eugene Police Department reported twenty-nine accidents involving bicycles. Only one did not involve a motor vehicle. During the same time period, twenty accidents involving bicycles and motor vehicles were reported in the Voluntary Report survey. Of the twenty-nine Police Reports and nineteen Voluntary Reports, nine were duplicates. The total number of bicycle-motor vehicle accidents reported for the time period was thirty-nine, one-fourth of which were not reported to the Police. There are several reasons for the nineteen accidents described in Police Reports, but not in Voluntary Reports. For each of the nine accidents in which both reports were completed, the motor vehicle driver was apparently at fault. The accidents in which only Police Reports were filed, included accidents in which the bicycle driver was at fault (sidewalk riding collisions and parked car collisions). The individuals involved in these accidents may have been reluctant to complete a Voluntary Report of the accident. Accidents described in some Police Reports involved severe injuries, where it was not likely that a Voluntary Report would be completed. Also, voluntary report forms may not have been available to every person treated for a bicycle-related injury. The ten injury accidents involving bicycles and motor vehicles for which only a Voluntary Report was filed, included:
Although the Oregon Department of Transportation requires that a report of any traffic accident in which a bodily injury was sustained or damages exceed $200.00 be filed, the bicycle driver is often reluctant to file a report and possibly assume liability. In other cases, the bicycle driver may not be aware of the responsibilities of drivers involved in a traffic accident. For this survey, the respondents to the Voluntary Questionnaire remained anonymous. No instructions concerning driver responsibilities were provided on the questionnaire. BICYCLE-ONLY ACCIDENTSA single bicycle accident which did not involve a motor vehicle was described in the Police Reports. Sixty bicycle accidents which did not involve a motor vehicle were described in the Voluntary Reports. Thus, it is apparent from the survey results, that although 61% of bicycle injury accidents do not involve motor vehicles, less than 2% of these accidents are described in Police Reports. The bicycle accidents which did not involve motor vehicles included:
The bicycle accidents involving bicyclists losing control included:
Bicycle accident reports and descriptions of bicycle accidents not involving motor vehicles, are necessary to plan effective countermeasure improvements. Such improvements as described in Chapter VI include sight distance, fixed objects, and other hazardous conditions, pedestrian-bicycle conflicts and poor or improper bikeway maintenance. SUMMARYThe injury accident survey has shown that nearly three-fourths of all injury bicycle accidents are not reported. About one-fourth of the bicycle-motor vehicle accidents are unreported. Nearly all injury bicycle accidents that do not involve a motor vehicle go unreported. For this survey, report forms were made available in local hospitals and clinics. Bicycle injury accidents usually required timely treatment available in hospital emergency rooms, and 97% of the reports were received there. The information from the voluntary reports is useful to the City. Problems are identified and improvements are recommended using these survey reports. The reports listed locations of unpainted traffic islands, problem railroad tracks, large sidewalk cracks, blind corners, and gravel on bike trails. MONITORING BICYCLE ACCIDENTSMonitoring bicycle accidents provides the information necessary to identify hazards and to plan improvements. Chapter III demonstrates how accident records can be used to identify sections of existing bicycle facilities and streets, which have proven hazardous to bicyclists. Accident records reveal locations where accident rates and frequencies are high. Classifying the bicycle accidents reveals the most frequent accident types and appropriate countermeasures. The injury accident survey determined that 70% of all injury bicycle accidents are unreported. Locations where improvements can make bicycling safer were revealed by the survey. Monitoring policies and practices are summarized under the following sections
A revised manual card record system for bicycle accidents was implemented during this project. The original card record listed only the location, date and time, vehicle travel directions, number of injuries and violations. All information was written on a single card line. Rather than cataloging according to the street which the bicyclist was riding, accidents were cataloged alphabetically according to the word names of the nearest intersection. Accidents on numbered streets were cataloged on the nearest intersecting named street. Classifying accidents and determining the number of accidents along a specific route was difficult. The system was not useful for cataloging accidents that did not have a corresponding Police Report. The short written description of the accidents were difficult to decipher. BICYCLE ROUTE EVALUATIONSThe card used for the revised card record system is shown in Figure IV-2. A small diagram of the collision provides a description of the accident and location without a written description. The date, time, severity of injury, age and sex of the bicyclist, light conditions and pavement conditions are also included on the card. The cards are filled out and filed by staff personnel in the Traffic Engineer's office. |
FIGURE IV-2
SAMPLE - REVISED BICYCLE
ACCIDENT REPORT
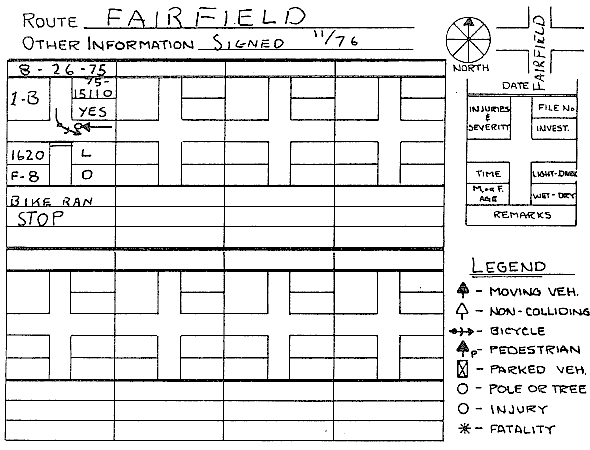
| This sample from the revised report system, describes an accident in which an 8 year
old female bicycle driver rode past a STOP sign at the southern end of Fairfield Road. As
the bicyclist was turning left onto Elmira Road, she was struck and injured by a vehicle
traveling west on Elmira Road. The injury was major but non-incapacitating (Injury Code B,
as described on the Police Traffic Accident Report Form). The description of the
investigated accident is on Report Number 75-15110. The accident occurred at 4:20 PM, on
August 26, 1975, under light and dry conditions. The accident was caused by the bicyclist
ignoring the STOP sign. It is recommended that this new card system be maintained by the City of Eugene. All bicycle accidents reported between January 1974 and December 1978, have been successfully cataloged on the cards. This card system should be updated monthly including both the Police Reported Accidents and the appropriate Voluntary Reports. As the accidents are cataloged, improvements should be identified and efforts begun to implement the identified improvements. VOLUNTARY ACCIDENT SURVEYDescriptions of many of the accidents which go unreported, could provide useful information for problem identification. It is recommended that the City distribute Voluntary Bicycle Accident Report forms to the Emergency Rooms of Sacred Heart Hospital, the Eugene Hospital and Clinic, and the University of Oregon Student Health Center. This 5" x 8" card form shown below, should be made available and monitored monthly in these locations. The location and dates of the accidents provide a ready cross-reference to the Police Accident Reports. The information collected during the original survey has proven valuable, and the City should continue to collect this information. |
FIGURE IV-3
PROPOSED VOLUNTARY ACCIDENT SURVEY CARD
HELLO! SORRY ABOUT YOUR BICYCLE ACCIDENT. WE WOULD LIKE TO PLAN WAYS TO
MAKE BICYCLING SAFER IN EUGENE. WILL YOU HELP BY FILLING OUT THIS CARD?
THE MAYOR'S BICYCLE COMMITTEE THANKS YOU.
1. DID YOUR ACCIDENT HAPPEN ON:
_/ STREET OR INTERSECTION _/ PRIVATE PROPERTY
_/ BIKE PATH _/ SIDEWALK
2. WHAT KIND OF ACCIDENT? _/ BICYCLE HIT CAR _/ CAR HIT BICYCLE
_/ BICYCLE HIT BICYCLE _/ BICYCLE HIT FIXED OBJECT
_/ FALL _/ OTHER__________________________________
3. WHEN DID THE ACCIDENT HAPPEN? MONTH DAY YEAR 4. WHERE DID THE ACCIDENT HAPPEN? 5. PLEASE DESCRIBE WHAT HAPPENED: |
BICYCLE ROUTE EVALUATIONSThe card record file of bicycle accidents should be analyzed annually to identify problem corridors and evaluate bikeway system improvements. Accident rate determinations provide the information necessary to make comparisons. A format for bike route evaluations is shown in Figure IV-4. |
FIGURE IV-4
PROPOSED BICYCLE ROUTE EVALUATION FORMAT
BICYCLE ROUTE EVALUATION CITY OF EUGENE, OREGON Date: Bicycle Route Length
Type of Improvement
  Before Conditions
       Number of Bicycle Accidents
       Time Period (years)
       Average Daily Bicycle Traffic
            Bicycle Accident Rate
  After Conditions
       Number of Bicycle Accidents
       Time Period (years)
       Average Daily Bicycle Traffic
            Bicycle Accident Rate
* Accident Rate = Accidents per 100,000 bicycle miles per year = (Accidents)
(Years)x(365 days)x(Bicycles)x (Miles)
(year) ( day ) (100,000 miles)
|
| The evaluation form provides a project description and comparisons of accident frequencies, bicycle volumes and accident rates. Routes identified as having high or increasing accident rates should be studied and evaluated to identify problems and to plan improvements. Routes which have low or decreased accident rates, are locations where improvements are not necessarily required or have been successfully implemented. Studying the successes as well as the problems, is important for the identification of useful improvements. |
| Top: John S. Allen's Home Page Up: Table of Contents Previous: Page separator Next: Chapter V separator |
Government document, public domain Last modified March 26, 2003 |